Australia’s solar industry is losing $400 million annually to preventable underperformance, with NSW farms facing a critical operational challenge: determining when production losses stem from dirty panels versus actual equipment failures. This distinction matters enormously—dispatching cleaning crews for a hardware fault wastes thousands of dollars while the real problem compounds, yet treating equipment degradation as a soiling issue leaves revenue bleeding for months. Advanced AI systems are now achieving 97-99% accuracy in making this crucial differentiation, unlocking an 8% annual revenue uplift for operators who implement these technologies. For a 100 MW solar farm in NSW, this translates to $1.6 million in additional annual revenue while simultaneously reducing O&M costs by 25%. The business case has become undeniable: AI-based fault detection systems pay for themselves in under six months, even with conservative assumptions, while the labor shortage facing Australia’s renewable sector makes manual inspection increasingly infeasible as the industry races toward its 2030 targets requiring 40,000 additional workers.
The distinction between soiling and hardware faults isn’t merely academic—it fundamentally drives operational decisions that impact both immediate costs and long-term asset value. NSW operators face particularly complex conditions, with western regions experiencing dust storms “so thick they blocked out the sun” causing 25-30% production drops during smoke and dust events, while coastal installations battle salt accumulation alongside lower but persistent soiling rates. Equipment faults have simultaneously intensified, with underperformance metrics climbing from 1.61% in 2019 to 4.47% in 2023 as the installed fleet ages and system complexity increases. The challenge lies in distinguishing these overlapping signatures quickly enough to dispatch the right response—cleaning crews averaging $800-1,500 per truck roll to remote NSW sites, or specialized repair technicians at $52-60 per hour for electrical diagnosis.
Why traditional inspection methods fail in utility-scale operations
Manual inspection approaches that sufficed for early solar deployments have become fundamentally inadequate for modern utility-scale operations in NSW. Visual site walks can only detect obvious soiling and physical damage, missing the subtle degradation patterns that cumulatively drain millions in revenue. A single technician walking a 100 MW facility—comprising roughly 300,000 modules—might cover just 10-25% in a comprehensive inspection, leaving three-quarters of potential faults undetected while consuming weeks of labor time at $30-60 per hour.
Drone thermal imaging represented a major advancement, capturing high-resolution thermal data (640×512 pixels detecting temperature variations as small as 0.1°C) across entire facilities in 2-4 hours. Yet drones require specific environmental windows—minimum 600 W/m² irradiance, winds below 5 m/s per IEC 62446-3:2017 standards—limiting deployment flexibility. The inspection generates thousands of thermal images requiring expert interpretation, a process that Queensland’s Solaris AI team describes as analyzing “millions” of data points manually. Even quarterly drone flights create temporal gaps where developing faults compound undetected for 90 days.
String-level monitoring via SCADA systems provides continuous data but generates its own challenges. Performance ratio calculations, string current comparisons, and power output tracking excel at identifying that underperformance exists, yet struggle to pinpoint whether the culprit is dust accumulation, a failing bypass diode, or incipient potential-induced degradation. The data volume overwhelms human operators—a utility-scale facility’s SCADA might process 725 million voltage data points from micro-PMU systems alongside meteorological readings, combiner box outputs, and inverter telemetry. Finding the meaningful signal in this noise requires sophisticated pattern recognition beyond manual capability.
The labor economics compound these technical limitations. Clean Energy Council projections show 40,000 additional workers needed by 2030 across Australia’s renewable sector, with electricians and specialized solar technicians already in critical shortage. VET training providers report operating at maximum capacity, unable to accept full apprentice cohorts despite surging demand. This structural workforce gap means manual inspection models cannot scale to meet the 2.6x capacity expansion required to reach 44 GW of grid-scale wind and solar by 2030. Remote NSW solar farms in regions like Broken Hill, Nyngan, and Moree struggle particularly hard to attract qualified staff, forcing reliance on expensive fly-in specialists and extended response times that allow minor issues to metastasize into major failures.
The thermal and electrical signatures that distinguish fault types
Understanding how soiling and hardware faults manifest differently in thermal and electrical data forms the foundation for AI-based classification. Soiling typically produces minimal thermal signatures—temperature variations under 5°C across affected modules—because dust layers reduce incoming light uniformly rather than creating localized resistance heating. The electrical signature shows proportional reductions in short-circuit current (Isc) while open-circuit voltage (Voc) remains relatively stable, and the I-V curve maintains its characteristic shape but shifts downward. Power loss accumulates gradually, typically 0.05-0.5% daily in moderate to high soiling environments, with NSW data showing 3-8% annual losses absent cleaning intervention.
Hardware faults present dramatically different signatures. Hot spots from cell defects or microcracks generate temperature elevations of 10-55°C above surrounding cells, appearing as localized bright zones in thermal imagery rather than the diffuse patterns of soiling. A bypass diode failure creates a distinctive checkerboard pattern within the affected substring, with very high temperature variations across individual cells rather than the uniform heating seen when a substring is merely bypassed due to shading. String-level open circuits cause entire strings to run 3-5°C warmer uniformly, representing stored energy that cannot discharge, while inverter IGBT failures show harmonic distortions in the 50 Hz input current that increase linearly with MOSFET degradation.
Junction box issues manifest as significantly elevated temperatures at the box itself—often 15-40°C above normal—detected through the backsheet, wafer and glass layers. The thermal energy concentration at connection points distinguishes electrical resistance problems from soiling’s surface-level effects. I-V curve analysis reveals additional fault signatures invisible to thermal imaging: stepped curves indicating current mismatch from non-uniform cell damage, reduced fill factors suggesting high series resistance from corroded connections, or the characteristic voltage reduction of one-third when a single bypass diode fails in open-circuit mode.
Potential-induced degradation presents one of the more challenging diagnostic scenarios, producing edge-initiated heating patterns that progress across modules with 5-15°C temperature elevations in checkerboard distributions. Unlike soiling’s reversibility, PID represents electrochemical changes in cell materials that persist until system-level grounding modifications address the root cause. Tracker failures—which increased from 0.26% to 0.46% power loss between 2022 and 2023—create characteristic time-of-day signatures where morning and evening generation falls disproportionately short of modeled expectations, a pattern distinct from soiling’s broad production suppression.
The critical differentiator across these fault types is persistence and localization. Soiling affects large areas similarly and responds to rainfall or cleaning, while hardware faults remain constant or worsen despite environmental changes, concentrate in specific cells or modules following electrical topology, and require physical repair rather than surface cleaning. A hot spot at 25°C above ambient won’t cool after rain, but a soiling-induced 3°C elevation disappears. This distinction forms the basis for AI classification algorithms.
Machine learning architectures achieving classification accuracy above 95%
Modern computer vision models have achieved remarkable accuracy in distinguishing soiling from hardware faults by training on thousands of labeled thermal and visual images. YOLOv11-X, the latest generation of real-time object detection networks, delivers 89.7% precision and 92.7% mAP while processing thermal imagery at 25 frames per second, enabling automated drone inspection analysis without post-processing delays. These convolutional neural networks learn hierarchical features—edge detection at shallow layers progressing to complex fault patterns at deep layers—that capture the geometric signatures of cell defects, substring anomalies, and string-level issues invisible to traditional threshold-based analysis.
Lightweight CNN architectures optimized for edge deployment achieve even higher accuracy with dramatically reduced computational requirements. Research using Energy Valley Optimizer-trained networks reached 100% balanced accuracy while using only 9.72% of the parameters required by InceptionV3, enabling inference on Raspberry Pi-class hardware deployed at solar sites for real-time analysis. The training employs Continuous Wavelet Transform to convert 1D electrical signals into 2D spectrograms, allowing the same CNN architecture to process both thermal images and time-series electrical data through unified feature extraction.
Time-series analysis with LSTM networks and Transformer architectures addresses the temporal dimension critical for distinguishing degradation patterns. Temporal Fusion Transformers achieve R²=0.921 for solar irradiance forecasting, substantially outperforming LSTM baselines at R²=0.892, by explicitly modeling attention mechanisms that weight recent versus historical data appropriately. These architectures excel at detecting the gradual performance decline characteristic of soiling accumulation versus the sudden drops indicating equipment failure. CNN-LSTM hybrid models reach 92.9% accuracy for fault prediction by combining spatial feature extraction from imagery with temporal pattern recognition in SCADA data streams.
Anomaly detection algorithms provide crucial capability for identifying novel fault patterns not present in training data. Isolation Forest methods detected 453 anomalies in 45,740 observations, effectively flagging outlier behavior without requiring labeled examples of every possible fault mode. Autoencoder architectures, particularly LSTM-based recurrent autoencoders, achieve 91% precision and 88% recall by learning compressed representations of normal operation patterns, then flagging reconstructions with high error as anomalous. These unsupervised approaches prove particularly valuable as module technologies evolve and new degradation mechanisms emerge.
Transfer learning dramatically reduces the labeled data requirements that typically bottleneck AI deployment. Pre-trained models from ImageNet’s 1.4 million images provide foundational visual understanding, requiring only 500-2,000 site-specific images for fine-tuning to solar applications rather than the 5,000+ needed for training from scratch. Domain adaptation techniques enable knowledge transfer between module types—monocrystalline to polycrystalline, electroluminescence to infrared imagery—achieving 99.23% accuracy versus 98.67% for isolated training. Semi-supervised learning with graph-based label propagation reaches 92.8% accuracy with minimal labeled data by constructing similarity graphs across the unlabeled dataset and propagating known labels through the graph structure.
Ensemble methods combining multiple model architectures provide robust classification by averaging predictions across diverse algorithms. Random Forest, XGBoost, and CatBoost gradient boosting ensembles consistently achieve 99.4-99.98% accuracy for multi-class fault detection by training hundreds of decision trees on bootstrapped samples, then aggregating their predictions. The ensemble approach naturally handles the class imbalance problem where normal operation vastly outnumbers fault conditions, improving recall for rare but critical failure modes. Fine-tuned VGG-16 networks reached 99.91% detection and 99.80% diagnosis accuracy through ensemble voting across multiple CNN architectures and training folds.
Physics-informed AI integrates domain knowledge with data-driven learning
Pure data-driven approaches risk learning spurious correlations that fail when conditions deviate from training distributions. Physics-informed neural networks address this by embedding known physical relationships—the one-diode photovoltaic cell model, heat transfer equations, electrical circuit laws—directly into network architectures as constraints. This hybrid approach achieves RMSE under 0.3 for PV output simulations while requiring less training data than purely empirical models, since the network must satisfy both data fit and physical plausibility.
Digital twin technologies represent the most mature application of physics-informed AI in commercial solar operations. Raptor Maps’ platform managing over 80 million panels across six continents maintains virtual replicas of each installation, incorporating GIS data, electrical topology, equipment specifications, and historical performance records spanning 25+ years. The digital twin simulates expected performance under current conditions using physics-based models, then flags discrepancies between simulation and actual SCADA data as potential faults. This approach distinguishes between underperformance explained by weather patterns versus genuine equipment issues, reducing false positive rates that plague purely statistical methods.
Integration patterns combine model-based estimates with machine learning corrections. A Thevenin equivalent circuit model provides first-principles predictions of module behavior, while a neural network layer learns systematic residuals between the physics model and observed data. This architecture captures both the well-understood physics and the subtle second-order effects from manufacturing variations, installation conditions, and aging patterns. PSO-based maximum power point tracking algorithms integrated with fault detection achieve similar hybridization, using particle swarm optimization’s physics-inspired search alongside learned fault signatures.
The physics-informed approach proves particularly powerful for distinguishing soiling from bypass diode failures, both of which reduce substring output. The physics model predicts that soiling should affect all three substrings within a module similarly since dust accumulates across the entire surface, while diode failure impacts only the specific substring containing the failed diode. When SCADA data shows one-third module output reduction, the AI compares thermal imagery patterns against both hypotheses: uniform temperature distribution across the module supports soiling diagnosis, while the checkerboard temperature pattern within a single substring confirms diode failure. This hypothesis-driven approach achieves higher diagnostic confidence than pattern matching alone.
Seamless integration with SCADA systems enables real-time fault classification
Effective AI deployment requires continuous data streams from existing monitoring infrastructure rather than costly sensor additions. Modern SCADA systems capture 13+ parameters spanning DC characteristics (PV array voltage and current, boost converter parameters), AC output (inverter voltage, current, power factor), and environmental conditions (irradiance, temperature, humidity, wind). Sampling rates vary from 100 microseconds for arc fault detection to 5-second intervals for degradation monitoring, generating massive time-series datasets suitable for machine learning analysis.
String-level monitoring provides the optimal granularity for utility-scale fault detection, balancing diagnostic precision against infrastructure cost. Current sensors on each string (typically 15-25 modules) enable 98.7% fault detection accuracy using k-Nearest Neighbors classification of string current deviations from expected values. This resolution identifies which specific string requires attention without the complexity and expense of module-level monitoring, which would require sensors on 300,000+ modules at a 100 MW facility. String monitoring costs approximately $0.03-0.05 per watt versus $0.15-0.25 for module-level power optimizers, making it economically viable for utility scale while still pinpointing faults to manageable search areas.
Real-time processing architectures employ edge computing to minimize latency for critical faults while reserving cloud resources for complex analysis. Embedded processors running lightweight CNN models at combiner boxes or inverters provide sub-second response for safety-critical events like ground faults or arc detection. These edge systems filter the data stream, transmitting only anomalous patterns and aggregated statistics to cloud platforms where computationally intensive algorithms—transformer networks, ensemble models, digital twin simulations—run on full historical context. This hybrid architecture balances response speed against analytical depth.
API-first platforms following SunSpec Alliance standards enable integration across heterogeneous monitoring ecosystems. The typical utility-scale installation combines equipment from multiple vendors—SolarEdge or Tigo monitoring, SMA or Fronius inverters, combiner boxes from various manufacturers—each with proprietary data formats. Modern O&M platforms like 60Hertz Energy, Scoop Solar, and Raptor Maps provide 20+ pre-built integrations that ingest data via RESTful APIs, normalize formats, and feed unified streams into AI models. This architecture avoids vendor lock-in while enabling best-of-breed component selection.
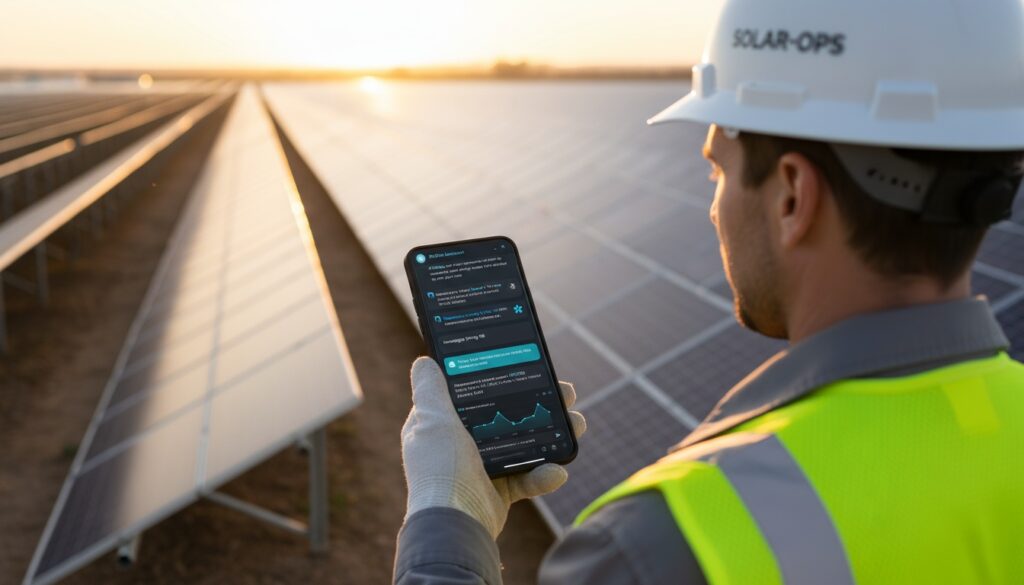
Automated alert systems translate model outputs into actionable dispatch decisions. Rather than overwhelming operators with raw SCADA deviations, AI platforms classify anomalies by severity—critical (fire risk, safety hazard, 100% outage), major (>10% production loss), minor (<10% impact)—and fault type, then auto-generate work orders with attached diagnostic data. Ensights’ platform demonstrated this workflow by triggering maintenance alerts seven days before failures occurred with 92.9% sensitivity, attaching thermal images and electrical traces that pre-position repair crews with correct spare parts and expertise. This closed-loop integration transforms detection into resolution without manual interpretation bottlenecks.
Building actionable workflows from detection through resolution
Effective fault classification requires systematic decision trees that guide operators from anomaly detection to verified resolution. The initial triage separates time-critical responses from scheduled maintenance: ground faults and inverter failures demand 4-8 hour response regardless of other factors, while string-level mismatches under 10% can wait for the next planned site visit. NSW’s remote solar farm locations make this prioritization crucial since each truck roll consumes $800-1,500 in travel, accommodation, and labor costs.
The clean versus repair decision pivots on multiple data points rather than single indicators. When SCADA shows underperformance, operators first check the soiling station—reference cells measuring clean versus soiled sensor output. A soiling ratio below 0.85 (soiled sensor producing 85% of clean sensor output) indicates cleaning could recover 15% production, making it the logical first intervention for distributed losses across multiple strings. Thermal imaging provides confirmation: if affected modules show minimal temperature deltas (<5°C) with uniform patterns, cleaning proceeds. Post-cleaning SCADA monitoring verifies recovery; if production rebounds to expected levels within 24 hours, soiling diagnosis was correct and no further action required.
Persistent underperformance after cleaning triggers hardware diagnosis protocols. Thermal re-imaging identifies localized hot spots, with temperature deltas above 10°C warranting immediate investigation. String current measurements isolate the affected circuit, while I-V curve tracing on that specific string reveals the electrical signature—stepped curves indicate cell-level damage requiring module replacement, while voltage reductions of precisely one-third point to bypass diode failure. This methodical narrowing from plant-level detection to component-level diagnosis minimizes the search space, enabling technicians to arrive with correct replacement parts rather than conducting iterative diagnostic visits.
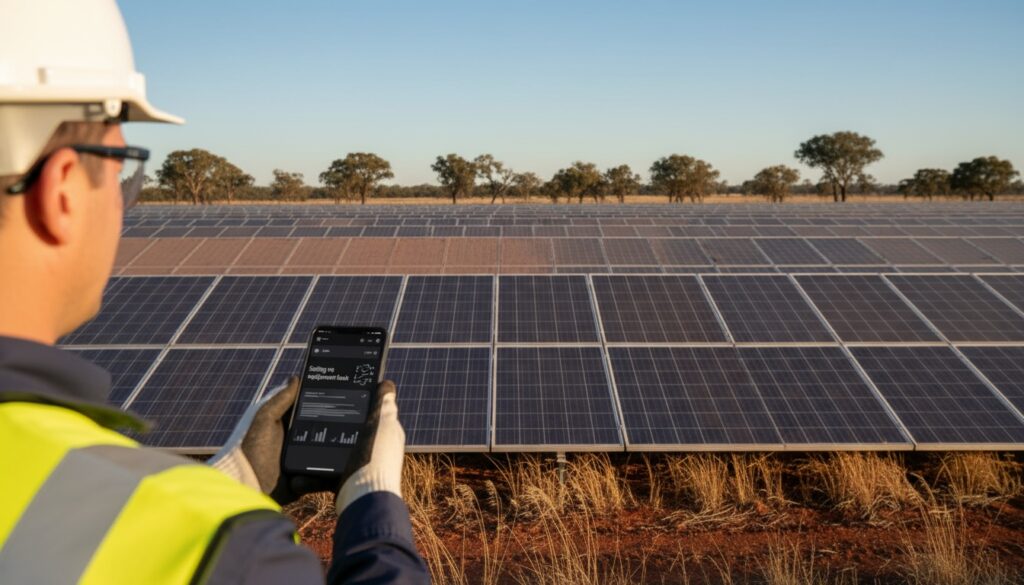
Mobile field applications close the loop by feeding resolution data back into AI training sets. Platforms like Scoop Solar and 60Hertz Energy provide offline-capable apps with GPS navigation to exact module locations, pre-loaded work orders with thermal images and electrical data, and photo documentation workflows. When technicians mark a work order complete and document the actual fault found—bypass diode, cracked cell, loose connection—this ground truth label updates the training dataset. Over time, the AI models tune to site-specific patterns, learning that certain thermal signatures at this particular installation correlate with specific failure modes, progressively improving classification accuracy beyond generic models.
Robotic cleaning systems integrate with AI detection to optimize cleaning schedules. Rather than fixed-interval cleaning, Ecoppia’s autonomous waterless robots receive dispatch signals when soiling sensors and AI analysis indicate accumulated losses exceed economic thresholds. For NSW installations experiencing seasonal dust storms in Spring-Summer, this might trigger nightly cleaning during peak soiling months, scaling back to weekly or monthly in Winter when rainfall provides natural cleaning. The system learns optimal thresholds by tracking production recovery per cleaning event, converging on the 5-7% loss threshold where cleaning costs are justified by recovered generation.
Economic imperatives driving AI adoption in NSW’s competitive market
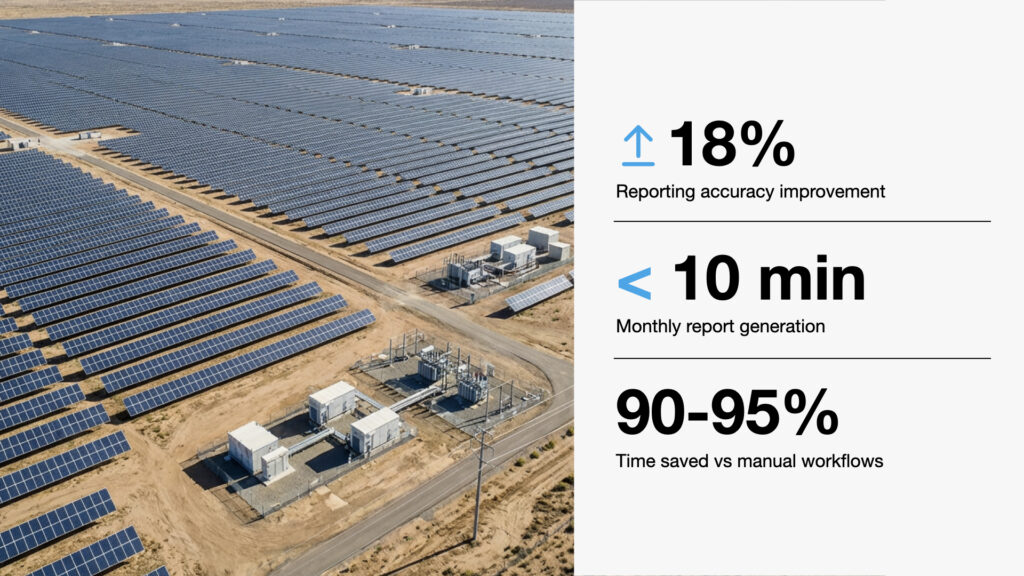
The financial case for AI-based detection systems rests on three revenue components: direct production gains from faster fault resolution, avoided losses from early detection, and O&M efficiency from targeted dispatch. For a 100 MW solar farm in NSW, base annual generation approximates 200,000 MWh at a 23% capacity factor. With Q4 2024 NSW wholesale prices averaging $100-104 per MWh, gross annual revenue reaches $20-21 million. University of Queensland’s Solaris AI system demonstrated 8% annual revenue uplift potential, translating to $1.6 million additional revenue through faster fault detection, optimized maintenance scheduling, and reduced soiling losses.
The avoided underperformance component adds substantial value beyond production optimization. Solar assets installed since 2015 underperform forecasts by 7-15% according to industry tracking, with 2023 data showing average power losses of 4.47% from string faults (0.90%), combiner issues (0.81%), inverter failures (1.91%), and tracker problems (0.46%). For the same 100 MW facility, eliminating this 4.47% underperformance recovers $894,000 annually in otherwise-lost generation. Conservative estimates assuming AI systems capture only half this opportunity still yield $450,000 annual benefit.
O&M cost reductions provide the third revenue stream. Traditional reactive maintenance with quarterly manual inspections and unscheduled truck rolls costs $5-8 per kW-year for full-service contracts. AI-driven predictive maintenance demonstrated 25% O&M cost reductions over five-year periods by eliminating unnecessary site visits, extending maintenance intervals through condition-based servicing, and preventing catastrophic failures through early intervention. For 100 MW at $6.50/kW-year baseline, this 25% efficiency gain saves $162,500 annually. The labor shortage amplifies these savings as technician wages rise—already $52-60 per hour for solar engineers in Sydney—and competition intensifies for scarce electrical expertise.
Truck roll optimization delivers immediate measurable savings. Without AI detection, operators dispatch crews reactively to production anomalies without knowing whether cleaning, electrical repair, or inverter reset is required. This often necessitates multiple visits: initial diagnosis, return with parts, possible third visit if diagnosis was incorrect. At $800-1,500 per remote NSW truck roll, a single misdiagnosis wastes $2,400-4,500 in unnecessary travel plus the opportunity cost of continued underperformance during the diagnostic cycle. AI systems providing 97-99% classification accuracy eliminate false starts, enabling first-time-right dispatch with appropriate expertise and parts.
The investment requirements prove remarkably modest against these benefits. Software licensing for AI analytics platforms typically runs $50,000-150,000 annually for 100 MW installations, with $100,000-200,000 implementation costs in year one. Total first-year expenditure of $150,000-350,000 contrasts against combined benefits of $2.7 million (revenue uplift plus avoided losses plus O&M savings), yielding 2-6 month payback periods. Even conservative scenarios assuming half the claimed benefits—4% revenue uplift, 50% of avoided underperformance, $100,000 O&M savings—generate $1.35 million annual value against $100,000 recurring cost, representing 1,250% annual ROI.
Alternative approaches cannot match this cost-benefit profile. Quarterly drone thermal inspections cost approximately $50,000-100,000 per comprehensive flight, totaling $200,000-400,000 annually for continuous monitoring while still leaving 90-day gaps between inspections. Increasing manual inspection frequency to weekly intervals would require 2-5 hours per MW weekly, or 200-500 hours for 100 MW, consuming $520,000-1.3 million annually in labor at $50/hour while still sampling only a fraction of modules. Robotic cleaning systems require $500,000-2 million capital investment with 3-5 year payback horizons, though they complement rather than compete with AI detection.
Australia’s renewable workforce crisis makes automation essential
The structural labor shortage facing Australia’s renewable sector transforms AI adoption from competitive advantage to operational necessity. Clean Energy Council projections show 40,000 additional workers required by 2030—a 133% increase from the ~30,000 currently employed—to support the capacity expansion from 17 GW to 44 GW of grid-scale wind and solar. Electricians represent the most acute shortage, with 32,000 additional electrical professionals needed against training pipelines already operating at maximum capacity and VET instructor shortages constraining apprenticeship growth.
NSW solar farms face particularly severe recruitment challenges. Remote installations in Broken Hill, Nyngan, and Moree regions struggle to attract qualified staff willing to relocate from coastal cities where 80%+ of Australia’s population concentrates. Site visits from metropolitan-based technicians incur travel premiums—accommodation, per diems, distance charges—that Darwin operators report as 25% cost premiums relative to Perth or Melbourne. Some installers levy surcharges for sites beyond 80km from their base, compounding the economic disadvantage of western NSW’s prime solar resource areas.
The skills pipeline cannot scale fast enough even with aggressive training investments. Electrical apprenticeships require 3-4 years for qualification, meaning workers entering programs today won’t be available until 2027-2028, perilously close to the 2030 targets. University electrical engineering programs face similar timelines, and over 50% of Australia’s electrical engineers were born overseas, making the sector vulnerable to immigration policy changes. The RACE for 2030 projections show 12,000 additional workers needed by 2025—impossible to meet through domestic training given current class sizes and instructor availability.
AI-based systems address this structural constraint by dramatically reducing the labor intensity of solar O&M. Continuous automated monitoring replaces periodic manual inspections that might consume 200-500 hours quarterly at 100 MW scale. Targeted dispatch enabled by accurate fault classification eliminates the exploratory site visits that waste technician time on misdiagnoses. Predictive maintenance scheduling concentrates human expertise on confirmed issues rather than blanket preventive work, potentially reducing total labor requirements by 30-40% while improving outcomes. These efficiency gains enable existing workforce levels to support larger installed capacity as the fleet grows toward 2030 targets.
The automation economics improve as wages rise due to labor scarcity. Solar technician salaries averaging $66,844 annually ($32/hour) and engineers commanding $124,632 ($60/hour) in Sydney create strong incentives to minimize labor-intensive activities. Each hour of avoided manual inspection saves $30-60, quickly amounting to substantial savings across utility-scale operations requiring hundreds of annual maintenance hours. Robotic cleaning systems achieve 70% cost savings versus weekly manual cleaning by eliminating recurring labor while improving consistency—a waterless Ecoppia robot running nightly costs less over five years than paying cleaning crews despite million-dollar capital investment.
Regional characteristics of NSW’s solar fleet shape operational strategies
NSW’s diverse geography and climate create distinct operational profiles for solar installations across the state. Western regions—Broken Hill, Nyngan, Moree—experience the highest solar irradiance in Australia combined with dust storms “so thick they blocked out the sun”, causing 25-30% production drops during extreme events. CSIRO research at Newcastle documented 10-30% energy production reductions during smoke and dust events compared to previous years, while Western NSW sites saw efficiency drop to 20% of initial values within five months without cleaning during drought conditions. These high-soiling environments justify robotic cleaning investments despite capital costs, since manual cleaning 4-6 times annually becomes economically prohibitive.
Coastal NSW installations face different challenges despite lower soiling rates. Salt accumulation from ocean breezes creates hygroscopic deposits that attract moisture, accelerating corrosion in junction boxes and connectors while potentially causing electrical leakage paths. Higher annual rainfall—often exceeding 800mm versus 300-400mm inland—provides natural panel cleaning that reduces soiling-related losses to 1-3% annually for tilted installations. The operational implication: coastal sites benefit more from electrical monitoring and corrosion prevention than intensive cleaning programs, while thermal imaging focuses on detecting moisture ingress and connection degradation rather than dust-induced hot spots.
The seasonal pattern of soiling follows NSW’s climate cycles, with peak accumulation during Spring-Summer months when dry conditions combine with agricultural activity and bushfire season. Pollen accumulation in Spring, harvest-related particulates in Summer-Autumn, and bushfire ash during extreme fire weather create compound soiling from multiple sources. The fine particles under 2.5 microns—representing 60-70% of accumulated soiling—prove most damaging because they fill micro-textures in anti-reflective coatings, reducing light transmission more severely than coarser dust. National studies found peak dust emissions of 1.4 g/m² during Spring-Summer, translating to 3% energy reductions without natural removal mechanisms.
Project scale in NSW has grown substantially, with average installation size increasing from 13.9 MW in 2019 to 59.6 MW in 2023. This scale shift amplifies both risks and benefits of advanced monitoring—a 60 MW facility at $100/MWh wholesale prices generates $12 million annually, meaning each 1% production loss costs $120,000. The economic threshold for technology investment rises proportionally: a $200,000 monitoring system at 60 MW scale addresses a much larger revenue base than the same investment at a 10 MW site. The trend toward larger installations creates increasingly favorable economics for AI, robotic cleaning, and autonomous drone inspection compared to manual methods that scale linearly with project size.
Network constraints affect operational strategy through curtailment and negative pricing exposure. NSW experienced 13.3% negative pricing events in Q4 2024, requiring zero or negative bids during periods of transmission congestion or oversupply. Operators facing curtailment risk gain disproportionate value from maximizing output during uncurtailed hours, since lost production cannot be recovered later. This shifts the economic calculus toward more aggressive fault detection and cleaning schedules—accepting higher O&M costs to ensure peak performance during revenue-generating periods. AI optimization helps manage this complexity by forecasting curtailment windows and scheduling maintenance during low-value hours.
Competitive technologies complement rather than replace AI analytics
The solar O&M technology landscape encompasses diverse tools suited to different diagnostic needs and operational scales. Autonomous drone systems like DJI Dock 2 with Raptor Maps analytics represent the cutting edge for periodic comprehensive inspections, flying pre-programmed missions to capture thermal and visual imagery without pilot intervention. A 181 MW Texas installation documented transition from quarterly piloted inspections to weekly autonomous flights, reducing response time to weather events from days to hours while eliminating travel and pilot costs. The $100,000-300,000 investment in drone-in-a-box systems pays back in 2-3 years at utility scale through earlier fault detection and labor savings.
Robotic cleaning addresses the soiling component with dramatically lower operating costs than manual crews. Ecoppia’s waterless autonomous system employs microfiber brushes and controlled airflow, running nightly on solar power with three-day battery backup and zero water consumption—critical for water-scarce regions. The robots clean 5+ million panels monthly with operational costs below manual cleaning long-term despite high initial capital. Serbot’s water-based systems offer alternatives for regions with water access, achieving 22 m/min cleaning speeds with operator supervision. Market projections show solar cleaning robotics growing from $621 million in 2021 to $1.228 billion by 2034 at 13.2% CAGR as installations scale and labor costs rise.
Satellite monitoring provides essential portfolio-level visibility and forecasting capability. Solargis, Vaisala, and SolarAnywhere deliver global coverage at 250m-1km spatial resolution with 1-15 minute temporal granularity, offering 30+ years of validated historical data for benchmarking. Accuracy typically maintains MBE under 2% with ~2.65% uncertainty at 95% confidence. While insufficient for module-level fault detection, satellite data excels at performance benchmarking across geographically distributed assets, backup validation when ground sensors fail, and irradiance forecasting for trading and dispatch optimization. The subscription-based pricing proves more economical than extensive ground sensor networks for multi-site portfolios.
Traditional methods retain crucial niches despite automation advances. Handheld thermal cameras ($3,000-15,000) and I-V curve tracers like Fluke’s SMFT-1000 provide detailed module-level diagnosis essential for commissioning, warranty verification, and troubleshooting complex failures that automated systems flag but cannot fully characterize. These tools enable the deep-dive electrical analysis—measuring short-circuit current, open-circuit voltage, fill factor, and maximum power point—necessary to distinguish cell degradation from bypass diode issues from interconnect failures when AI classification produces ambiguous results.
The optimal technology stack combines complementary capabilities rather than betting exclusively on single approaches. A typical utility-scale operation integrates continuous SCADA monitoring with AI analytics, semi-annual drone thermal inspections, satellite data for portfolio benchmarking, and targeted deployment of handheld diagnostic tools when automated detection flags anomalies requiring detailed characterization. This layered approach provides both broad coverage and diagnostic depth, with AI serving as the orchestration layer that prioritizes when and where to deploy more intensive—and expensive—diagnostic resources.
Technical fundamentals: interpreting thermal and electrical signatures
Understanding thermal imaging interpretation provides operational teams the foundation for validating AI classifications and conducting field diagnosis. All objects emit infrared radiation proportional to temperature, with thermal cameras detecting this IR and converting it to visible images where color represents temperature. Normal solar panel operation shows uniform temperatures across modules, typically 15-35°C in temperate conditions, with acceptable variation within ±5°C. Solar panels can reach 65°C surface temperature under full sun, but relative temperatures across the array matter more than absolute values.
Hot spots manifest as distinctly warmer areas—10-20°C above surrounding cells indicates potential issues warranting monitoring, while deltas exceeding 20°C demand immediate action due to fire risk. The pattern reveals the cause: a single hot cell within an otherwise normal module suggests cell damage or microcracking, an entire substring (one-third of the module) uniformly elevated indicates bypass diode activation from shading or failure, while hot junction boxes point to connection resistance. IEC 62446-3:2017 standards require inspections during minimum 600 W/m² irradiance with winds below 5 m/s to ensure panels operate under load and convective cooling doesn’t distort readings.
Soiling shows minimal thermal impact because dust acts as an insulating layer reducing both incoming light and outgoing heat relatively uniformly. Temperature variations typically remain under 5°C, appearing as subtle gradients rather than sharp boundaries. The distribution follows soiling accumulation patterns—heavier at bottom edges of tilted panels after partial rain cleaning, or uniform across horizontal surfaces. After cleaning, soiling-induced temperature variations disappear, while hardware fault signatures persist—the key distinction enabling visual confirmation of AI classifications.
I-V curve analysis provides the electrical complement to thermal imaging. This graph plotting current versus voltage across a module’s operating range reveals performance characteristics invisible to cameras. The short-circuit current (Isc) at zero voltage indicates light collection capacity, reduced by soiling, shading, or cell damage. The open-circuit voltage (Voc) at zero current reflects cell quality and temperature, declining with degradation. The maximum power point at the curve’s “knee” shows optimal operating conditions, while fill factor—the ratio of actual maximum power to theoretical maximum (Voc × Isc)—quantifies how closely the real curve approaches the ideal rectangular shape, with healthy modules achieving 75-85%.
Fault signatures in I-V curves take distinct forms. Stepped or notched curves indicate current mismatch between cells, typical of partial shading or non-uniform cell damage activating bypass diodes at different voltages. Low Isc with normal Voc strongly suggests soiling or shading rather than cell degradation, since the cells maintain voltage generation capability but receive less light. Reduced fill factor with rounded knees points to high series resistance from poor connections, corrosion, or metallization degradation. A one-third voltage reduction precisely identifies bypass diode failure since each of the three substrings contributes equally to total voltage.
String-level performance monitoring exploits the series connection principle that current flows equally through all modules in a string, making the weakest module limit total output. Comparing string currents under identical irradiance conditions—correcting for orientation differences if some strings face different directions—reveals underperformers. Variations under 5-10% fall within normal manufacturing tolerances and measurement uncertainty, but deviations exceeding 15% indicate specific faults requiring investigation. Since adjacent strings typically share environmental conditions, a single outlier string at 85% of neighboring values signals an equipment issue rather than soiling, which would affect large areas uniformly.
The path forward: implementing AI detection in stages
Organizations approaching AI-based fault detection benefit from staged implementation that builds capability progressively while demonstrating value at each phase. Phase 1 establishes monitoring foundations over 1-3 months: deploying baseline SCADA systems if not already present, implementing basic work order management, conducting initial comprehensive inspections via drone or thorough manual survey to establish baseline conditions, and setting up satellite monitoring for benchmark comparison. This foundation costs $50,000-150,000 depending on existing infrastructure, creating the data streams essential for subsequent AI integration.
Phase 2 optimizes operations during months 4-9 by integrating the previously siloed systems. SCADA alarms automatically trigger work order creation, thermal imagery and electrical data attach to tickets providing field technicians full context, mobile apps enable offline access at remote sites with GPS navigation to exact module locations, and historical data analysis begins identifying seasonal patterns and optimal maintenance intervals. This phase requires process change and training more than additional capital, with the primary investment in integration services ($30,000-80,000) and staff time learning new workflows. The ROI emerges through reduced truck rolls as dispatchers leverage better information.
Phase 3 introduces advanced automation in months 10-18 with AI-based anomaly detection, predictive maintenance algorithms, automated cleaning if ROI analysis supports it, and digital twin platforms for performance simulation. This phase represents the major AI investment—$100,000-200,000 implementation plus $50,000-150,000 annual licensing. Organizations reaching this point with solid Phase 1-2 foundations integrate AI rapidly since data infrastructure and workflows already exist. The 2-6 month payback period materializes here as avoided underperformance and O&M efficiency gains compound.
Phase 4 pursues continuous improvement through ongoing refinement of AI models with site-specific training data, expansion of automation based on demonstrated ROI, workflow updates incorporating lessons learned, and adoption of emerging technologies like autonomous drone systems and ground robots. This ongoing phase consumes 10-20% of annual O&M budget focused on technology evolution, progressively reducing labor intensity while improving asset performance.
Pilot programs de-risk implementation by validating vendor claims before full deployment. Selecting one or two representative sites—ideally including both high and low performers to test detection across conditions—for 12-month trials establishes baseline performance, deploys AI systems with comprehensive data collection, and rigorously tracks production changes, O&M cost impacts, and false positive/negative rates. Even if actual uplift reaches only 50% of vendor claims, the ROI remains compelling, building organizational confidence for portfolio-wide rollout.
Emerging capabilities promise increasingly autonomous operations
The next five years will see utility-scale solar operations transition from reactive maintenance toward predictive and autonomous paradigms. Digital twins are achieving 96.9% fault detection sensitivity with seven-day advance warning capabilities, enabling maintenance scheduling during optimal weather and electricity price windows rather than emergency response mode. These virtual replicas simulate component wear patterns under actual operating history, predicting remaining useful life with sufficient confidence to implement just-in-time replacement strategies that avoid both premature replacement and catastrophic failures.
Autonomous inspection systems are maturing rapidly beyond current drone-in-a-box implementations. Ground-based robots navigating between panel rows would enable continuous monitoring without weather constraints that limit drone operations, capturing thermal and visual data daily rather than quarterly. Swarm robotics coordinating multiple robots could complete 100 MW inspections in hours, with AI directing robots toward anomalies detected by SCADA for detailed examination. The technology exists in adjacent industries—warehouse automation, agricultural monitoring—requiring adaptation to solar-specific needs and ruggedization for outdoor environments.
Self-cleaning technologies promise to eliminate soiling as an operational concern. Electrostatic dust removal systems apply controlled voltage pulses that repel charged dust particles without water or mechanical contact, while hydrophobic coatings reduce adhesion enabling wind and gravity to remove accumulation. Module manufacturers are integrating these capabilities at production, potentially making manual and robotic cleaning obsolete within a decade. Near-term implementations in 2025-2027 will likely combine sensors detecting soiling thresholds with automated dispatch of existing robotic cleaners, while 2028-2030 deployments may feature panels that self-clean continuously or on-demand.
The ultimate vision of fully autonomous solar farms—requiring human oversight only for strategic decisions and complex repairs—appears technically feasible by the 2031-2035 timeframe. AI would continuously monitor performance, dispatch drones or robots for detailed inspection of anomalies, diagnose faults through integrated thermal and electrical analysis, optimize cleaning schedules based on soiling accumulation and electricity prices, coordinate with grid operators for optimal dispatch, and schedule maintenance during low-value hours. Technicians would intervene only for physical repairs and component replacement, with 90%+ of O&M activities automated.
This autonomous future depends on continued AI advancement in three areas: more accurate fault classification approaching 99.9%+ to minimize false positives that erode operator trust, robust operation in edge cases that current models struggle with, and explainable AI that provides reasoning for classifications rather than black-box predictions. The regulatory framework must evolve alongside technology, establishing safety standards for autonomous operations, liability frameworks when AI systems make maintenance decisions, and workforce transition policies as automation displaces routine manual tasks while creating new roles in system oversight and continuous improvement.
Synthesis: the strategic imperative for NSW operators
AI-based differentiation of soiling versus hardware faults represents far more than incremental operational improvement—it fundamentally reshapes solar asset economics at a pivotal moment for Australia’s energy transition. The coincidence of rising underperformance costs (4.47% average losses in 2023), critical labor shortages (40,000 workers needed by 2030), and wholesale price increases (NSW averaging $100-104/MWh) creates perfect conditions for technology adoption that simultaneously improves revenue, reduces costs, and addresses workforce constraints.
For 100 MW installations in NSW, the quantified business case shows $2.7 million annual benefits against $100,000-150,000 recurring costs, yielding payback periods measured in months rather than years. Even conservative assumptions cutting claimed benefits by half still produce 1,000%+ annual returns. The regional characteristics of NSW—remote western installations with high soiling and truck roll costs, coastal sites battling salt corrosion, expanding project scale averaging 60+ MW—further strengthen the economic arguments compared to smaller, more accessible installations elsewhere.
The technology has matured beyond bleeding-edge experimentation into proven commercial deployment, with 97-99% classification accuracy from YOLOv11 and VGG-16 models, digital twins managing 80+ million panels across six continents, and University of Queensland’s Solaris AI demonstrating 8% revenue uplift in NSW conditions at Kidston and Collinsville commercial farms. The integration challenges that once hindered adoption have been largely solved through API-first architectures, SunSpec Alliance standards, and turnkey platforms from established vendors.
Organizations delaying implementation face mounting opportunity costs as each quarter of underperformance compounds lost revenue while competitors gain performance advantages. The labor shortage will intensify, not ease, as 44 GW of new capacity comes online by 2030, making today’s manual inspection models progressively less viable. NSW’s position in Australia’s renewable buildout—38% of connection queue projects—means the competitive pressure will only increase as operational excellence determines which assets secure favorable refinancing, perform under PPA obligations, and maintain investor confidence.
The recommendation for NSW solar operators is unambiguous: begin staged AI implementation immediately, starting with baseline monitoring and data integration, progressing to AI analytics pilot programs on 1-2 sites, then accelerating to portfolio-wide deployment upon validation. The technology has crossed the threshold from emerging to essential, with economic returns, technical maturity, and strategic necessity all aligned. Those who move decisively will capture years of performance advantage while labor and O&M costs remain manageable, while those who wait will find themselves forced to adopt under less favorable conditions with operational gaps already costing millions in lost generation.