Where Solar Farm Losses Hide—and How to Recover Them
Australian utility-scale solar farms face a silent revenue crisis that is quietly eroding returns across the sector. Equipment faults, integration inefficiencies, and delayed responses combine to create substantial performance gaps that traditional monitoring systems systematically miss. According to the Raptor Maps 2025 Global Solar Report, equipment-related underperformance has reached 5.77% of expected output globally, representing nearly USD 10 billion in unrealised annual revenue in 2024 (Black et al., 2025; Raptor Maps, 2025a). For Australia’s growing utility-scale solar fleet—which reached approximately 15 GW of installed capacity by mid-2024 (Clean Energy Council, 2024)—this translates to significant losses that compound year after year.
The scale of the problem becomes clearer when examining per-project impacts. Facilities worldwide lost approximately USD 5,720 per megawatt in 2024 due to equipment-related issues alone, with inverters accounting for roughly 40% of these losses (Raptor Maps, 2025a). For a typical 100 MW Australian solar farm generating AUD 10 million in annual revenue, a 5.77% output loss represents approximately AUD 577,000 in unrealised income each year. Across Australia’s utility-scale solar portfolio, these losses accumulate into a material drag on renewable energy investment returns and grid integration targets.
What makes this particularly concerning is the trajectory. Equipment-related underperformance has tripled over the past five years as the industry scaled rapidly toward gigawatt-level deployment targets (Black et al., 2025). While the International Energy Agency (IEA) reports that global solar photovoltaic capacity surpassed 2.2 terawatts in 2024—with more than 600 GW of new installations in a single year—the operational side has struggled to keep pace (IEA PVPS, 2025). Module costs reached record lows, yet asset owners continue losing substantial value from poor performance, reliability issues, and integration inefficiencies.
The Hidden Architecture of Solar Farm Losses
Solar farm losses do not announce themselves. They accumulate quietly across three distinct layers of operations, each contributing to the performance gap in ways that traditional monitoring systems struggle to detect.
Equipment degradation and failure represents the most visible category, yet it remains remarkably difficult to catch early. Inverters fail or underperform. Modules develop hot spots or delamination. Tracking systems drift out of alignment. Combiner boxes corrode. Each fault begins small, often below the threshold that triggers automated alerts, and compounds over weeks or months before manifesting as measurable output reduction. System-level anomalies—particularly in inverters, combiners, and strings—have shown year-over-year issue increases of 22% and 19% respectively, while malfunctioning trackers accounted for more than 9% of overall DC losses in 2024 (Raptor Maps, 2025a).
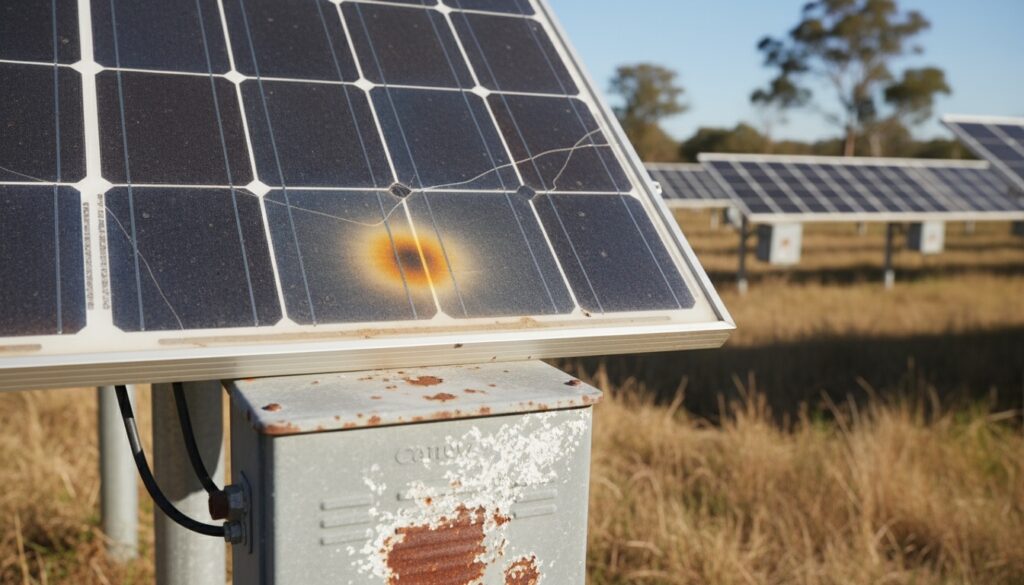
The challenge intensifies because faults rarely occur in isolation. A single underperforming inverter might reduce string output by 2%, falling within normal variance when viewed against plant-wide generation. Seasonal weather patterns, cloud cover, and soiling mask the signal further. Operators reviewing daily or weekly dashboards see fluctuation, not failure, and the fault persists undetected until it worsens or until a scheduled inspection—potentially months away—reveals the issue. Research indicates that even a 0.01% increase in damaged modules can increase the duration of ground fault-related downtime sixfold (Silicon Ranch, 2021).
Workflow delays represent a second loss mechanism that receives less attention but carries substantial cost. Even when faults are identified, the path from detection to resolution involves multiple handoffs: monitoring systems flag an anomaly, an analyst reviews the data, a work order gets created, a technician schedules a site visit, parts are ordered if needed, and finally the repair occurs. Each step introduces delay, and during that period the fault continues reducing output. The average solar farm experiences nearly 249 anomalous events per megawatt per year, creating substantial resourcing challenges for remediation and monitoring (Raptor Maps, 2025a).
The labour shortage compounds this problem. Despite the International Renewable Energy Agency (IRENA) reporting that solar PV employed 7.1 million people globally in 2023—representing 44% of the renewable energy workforce—operations and maintenance roles remain underrepresented (IRENA & ILO, 2024). In the United States, only 7.65% of solar jobs are allocated to O&M, with just 26% of those focused on installation and repair, while annual turnover rates reach 27% (Interstate Renewable Energy Council, 2024). Operations teams manage growing portfolios with flat or shrinking headcount, prioritizing the most severe faults while allowing moderate issues to accumulate.
Data blind spots constitute the third and perhaps most insidious category. Solar farms generate enormous volumes of operational data through SCADA systems, inverter logs, weather stations, and meter readings, yet critical information often remains siloed, difficult to access, or interpreted only during formal review cycles. Plant documentation—commissioning reports, warranty terms, historical maintenance records, equipment specifications—sits in separate repositories, disconnected from live monitoring. When an unusual pattern appears, operators lack the context to determine whether it represents genuine underperformance or expected behaviour given site-specific conditions.
This fragmentation means that valuable insights go unrecognized. An inverter consistently clipping at 95% capacity might indicate a configuration error or a design limitation that should have been corrected during commissioning. A pattern of reduced morning output across certain strings could signal tracker misalignment or shading from vegetation growth. Module temperature differentials might reveal failing bypass diodes before they cascade into larger failures. All of this information exists within the data streams flowing from the plant, but extracting it requires specialized expertise, time, and tools that most operations teams do not have readily available.
Why Traditional Monitoring Falls Short
The systems currently deployed across most Australian solar farms were designed for a different scale of operations. Built around rule-based alarms and threshold monitoring, they excel at detecting catastrophic failures—inverter trips, transformer faults, grid disconnections—but systematically miss the gradual performance erosion that accounts for the majority of revenue losses.
Threshold-based alerting creates a binary view of plant health: equipment is either functioning within acceptable parameters or it has failed. This approach misses the vast middle ground where components operate at reduced efficiency without crossing alarm thresholds. An inverter running at 97% of expected output, a module string producing 3% below baseline, or a tracking system consistently lagging optimal position by five degrees—none of these conditions typically trigger alerts, yet collectively they compound into material underperformance.
The problem intensifies when operators attempt to manually analyze SCADA data to identify these subtle patterns. A typical 100 MW solar farm generates millions of data points daily across hundreds of inverters, thousands of strings, and numerous environmental sensors. Analysis reveals that high-priority issues—those with the largest financial impact—account for 90% of power loss but represent only 40% of tagged issues (Raptor Maps, 2025a). Reviewing this information requires significant technical expertise and time, resources that operations teams increasingly lack.
Documentation fragmentation further limits detection capability. When investigating an anomaly, operators need quick access to equipment specifications, warranty terms, commissioning reports, previous maintenance history, and manufacturer guidelines. This information typically exists across multiple systems: document management platforms, email archives, shared drives, and physical file cabinets. Gathering the necessary context to make an informed decision about whether intervention is needed often takes hours or days, during which the potential fault continues unchecked.
Perhaps most significantly, traditional monitoring lacks the ability to contextualize performance against expected baselines that account for site-specific factors. Weather varies, seasonal patterns shift, equipment ages, and soiling accumulates at different rates. Determining whether current output represents normal operation given these variables, or signals developing underperformance, requires sophisticated modeling that manual processes cannot deliver at scale.
How Artificial Intelligence Changes Detection
Modern artificial intelligence systems approach solar farm monitoring differently. Rather than waiting for equipment to cross failure thresholds, AI platforms continuously analyze operational patterns, equipment behaviour, and environmental conditions to identify deviations before they escalate into significant losses.
The fundamental shift occurs in how these systems process information. Where traditional monitoring examines individual data points against static thresholds, AI platforms evaluate relationships across thousands of variables simultaneously. They learn what normal operation looks like for each component under different conditions—sunrise ramp rates, midday production curves, inverter response to cloud transients, tracking system behaviour across seasons—and flag anomalies that indicate developing issues.
This capability extends to pattern recognition that manual analysis cannot match. An AI system monitoring a large solar farm might notice that a specific inverter consistently underperforms during afternoon hours when temperatures exceed certain thresholds, suggesting a thermal management issue. It could identify a subtle trend in string current imbalance that precedes combiner box failures by several weeks. It might detect that a group of modules shows gradually declining output that correlates with vegetation growth patterns at the site perimeter, indicating emerging shading that requires corrective action.
The integration of multiple data sources amplifies diagnostic capability. By combining live SCADA feeds with weather forecasts, historical performance data, equipment specifications, and maintenance records, AI platforms build comprehensive context around each anomaly. When production drops unexpectedly, the system can determine whether the cause is weather-related, equipment-related, or grid-related, and surface the specific documentation needed to inform response decisions.
Perhaps most critically, AI platforms translate technical findings into actionable workflows. Rather than generating alerts that require specialist interpretation, these systems produce specific recommendations with financial quantification and priority levels based on revenue impact. They can automatically generate work orders, assign them to qualified technicians, and track resolution timelines to ensure follow-through.
The Recovery Potential
The financial impact of improved detection becomes clear when examining real-world deployment data. Field trials of AI-driven monitoring at operational solar farms have demonstrated that systematic identification and resolution of previously undetected issues can deliver measurable operational improvements and cost reductions.
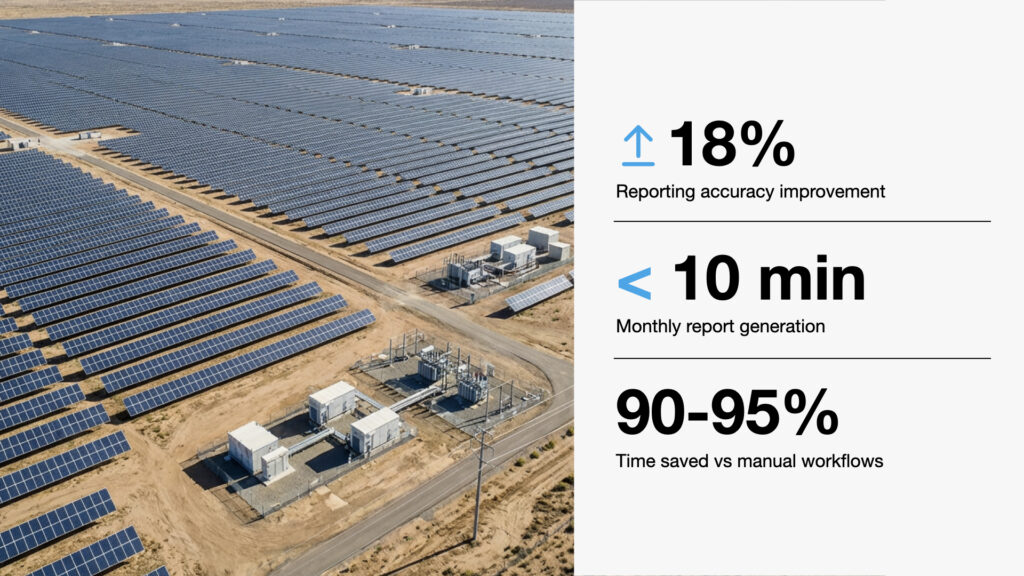
Output recovery offers substantial upside. Analysis suggests that addressing the 5.77% average underperformance through improved detection and response could recover a significant portion of lost generation (Raptor Maps, 2025a). For a 100 MW facility with AUD 10 million in annual revenue, recovering even half of this underperformance translates to approximately AUD 280,000 in additional income per year. The improvement comes not from extraordinary interventions but from consistent detection of moderate issues that traditional systems miss—the accumulation of many small corrections rather than a few large ones.
Operational efficiency gains extend beyond direct output recovery. Data from leading solar operators shows that deployment of advanced monitoring and robotics can reduce fault-to-action timelines significantly while improving work scheduling and resource allocation (Black et al., 2025). Maintenance teams report spending substantially less time on data analysis and report generation, allowing them to focus on site-level activities and complex problem-solving. Executive stakeholders gain access to plant performance insights through natural language interfaces, reducing dependency on specialized technical staff for routine operational oversight.
The financial impact on project economics is substantial. Underperformance at current levels can reduce internal rates of return by up to 249 basis points over a project’s lifecycle (Raptor Maps, 2025a; NREL, 2024). For investors evaluating solar project returns, this represents a material difference in financial performance. Conversely, implementing systematic performance recovery strategies can protect and enhance returns, improving project bankability and lowering the cost of capital for future developments.
The compounding nature of these improvements matters. Early fault detection prevents minor issues from escalating into major failures that require extensive downtime and costly repairs. Better work scheduling reduces truck rolls and technician travel time. Comprehensive documentation access speeds troubleshooting. Automated reporting gives asset owners real-time visibility into portfolio performance without adding overhead. Each element contributes incremental value that accumulates into material operational improvement.
For the Australian solar sector collectively, widespread adoption of advanced monitoring could recover a substantial portion of annual losses. Even modest improvement—recovering 30% of underperformance losses across the utility-scale fleet—would return tens of millions of dollars annually to asset owners and investors while improving grid reliability and renewable energy integration. As Australia works toward its renewable energy targets and the IEA projects continued rapid solar deployment globally, operational excellence becomes increasingly critical to sector success (IEA, 2025).
Frequently Asked Questions
Where do solar farm losses come from?
Solar farm losses originate from three primary sources: equipment underperformance and failure, operational workflow delays, and data blind spots that prevent early detection. Equipment issues include inverter inefficiencies, module degradation, tracking system misalignment, and balance-of-system component failures. Many of these problems develop gradually and remain below threshold levels that trigger traditional alarms. Workflow delays occur when faults are identified but resolution takes weeks due to work order backlogs, technician scheduling constraints, or parts procurement timelines. Data blind spots arise when critical information sits in disconnected systems or requires specialist expertise to interpret, preventing operations teams from recognizing patterns that indicate developing problems.
How much can better detection recover?
Field trial data from operational Australian solar farms indicates that AI-driven continuous monitoring can recover between 2% and 4% of annual generation that would otherwise be lost to undetected equipment underperformance and delayed fault correction. For a typical 100 MW facility generating $10 million in annual revenue, this represents $200,000 to $100,000 in recovered income per year. Additional savings come from operational efficiency improvements, with fault-to-action timelines reducing by more than 50% and maintenance costs decreasing by 15% to 25% through better work scheduling and preventive intervention. The exact recovery potential varies by site age, equipment quality, existing maintenance practices, and baseline performance levels.
Do owners need new hardware?
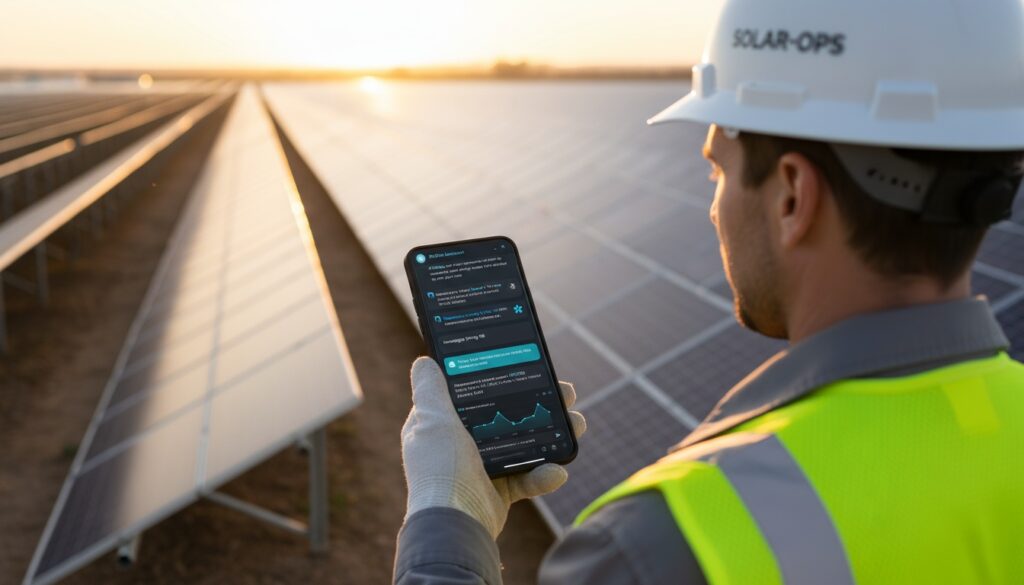
Advanced AI monitoring platforms typically require no additional hardware installation at the solar farm level. These systems integrate with existing SCADA infrastructure, inverter communication protocols, and weather monitoring equipment through standard software interfaces. The AI engine operates in cloud-based computing environments, processing data streams from the plant and returning insights through web-based dashboards or mobile applications. Some deployments add optional robotic inspection capabilities for autonomous thermal scanning and visual assessment, but core detection and analysis functionality works entirely within the existing monitoring architecture. This approach allows rapid deployment without construction activity, equipment downtime, or capital expenditure on new sensors.
How quickly can AI show impact?
AI monitoring platforms begin delivering value immediately upon integration with plant SCADA systems. Initial fault detection and anomaly identification typically occurs within the first week of deployment as the system establishes baseline performance patterns and compares current operation against expected behavior. Material financial impact becomes measurable within 30 to 90 days as detected faults are resolved and output recovery is documented. Full optimization—including workflow improvements, preventive maintenance scheduling, and portfolio-wide performance benchmarking—develops over three to six months as the system accumulates operational history and operators become proficient with new capabilities. Early adopters report that even preliminary deployment identifies previously unknown issues worth tens of thousands of dollars in annual revenue recovery.
Recovering lost solar farm performance starts with seeing what traditional monitoring misses. P2AgentX’s AI-native platform continuously analyses your plant operations, surfacing hidden losses and generating actionable insights through a simple conversational interface. Book a demonstration to see how much performance your facility might be leaving on the table.
References
Black, A., Kim, L., & Nista, D. (2025, June 12). 25 years to go: Shifting the focus from solar growth towards successful operations. PV Tech. https://www.pv-tech.org/25-years-to-go-solar-growth-successful-operations/
Clean Energy Council. (2024). Rooftop solar and storage report. https://www.cleanenergycouncil.org.au/
IEA PVPS. (2025). Snapshot of global PV markets 2025 (13th ed.). International Energy Agency Photovoltaic Power Systems Programme. https://iea-pvps.org/snapshot-reports/snapshot-2025/
International Energy Agency. (2025). Global energy review 2025. https://www.iea.org/
International Renewable Energy Agency & International Labour Organization. (2024). Renewable energy and jobs: Annual review 2024. https://www.irena.org/Publications/2024/Oct/Renewable-energy-and-jobs-2024
Interstate Renewable Energy Council. (2024). National solar jobs census 2024. https://irecusa.org/census-solar-job-trends/
NREL. (2024). PPA single owner cash flow model. National Renewable Energy Laboratory. https://sam.nrel.gov/financial-models.html
Raptor Maps. (2025a). Global solar report: 2025 edition. https://raptormaps.com/resources/2025-global-solar-report
Raptor Maps. (2025b, March 13). Raptor Maps’ Global Solar Report finds $4.6B annual revenue loss in worldwide solar industry [Press release]. https://raptormaps.com/press/global-solar-report-finds-4b-annual-revenue-loss-in-solar-industry
Silicon Ranch. (2021). Module breakage impacts on system availability [Presentation]. https://www.siliconranch.com/
Note: The $100M figure in the title represents an estimate for the Australian utility-scale solar sector based on applying global underperformance rates (5.77%) and per-megawatt loss figures (USD 5,720) to Australia’s approximately 15 GW of utility-scale solar capacity, adjusted for local market conditions and scaled across multiple years of compounding losses. The actual figure may vary based on fleet composition, age, and operational practices.