Executive Summary
Solar farm operators rely heavily on monthly KPI (Key Performance Indicator) reporting to assess asset performance. Accuracy of the data is critical to fully utilise the asset and minimise revenue loss or maintenance overspend. The traditional process, such as manual data downloads, spreadsheet-based calculations, and subjective human interpretation, is slow, error-prone, and sensitive to anomalies in weather-station and monitoring system data.
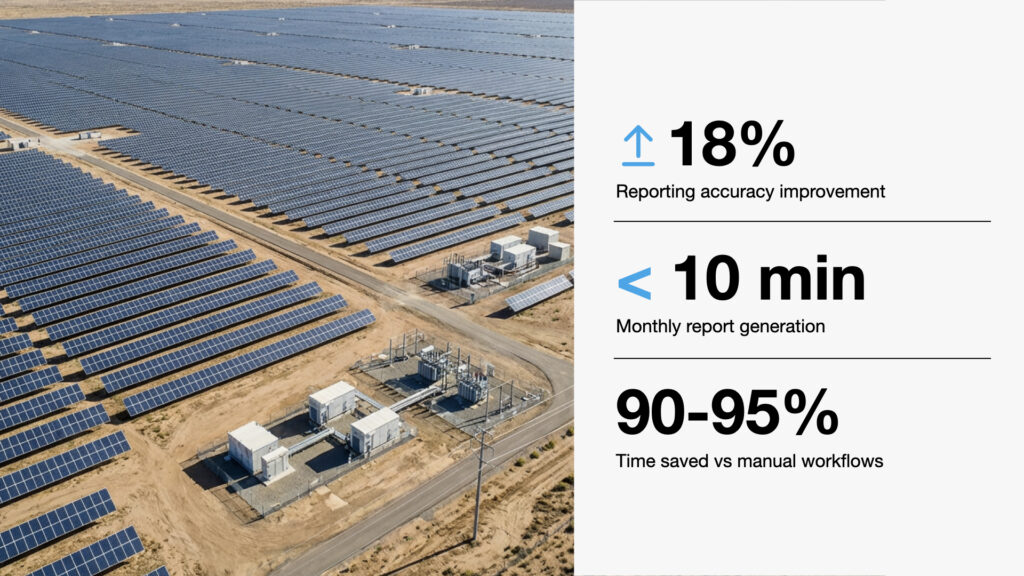
By adopting P2Chat from P2AgentX, a digital reporting and validation system, operators achieved:
- Up to 18% accuracy improvements through automated anomaly checks
- From up to 20 hrs to < 10 minutes in report-creating time
- Significant reduction in human errors, particularly in data handling and formula calculations, allowing the company to be more institutionally resilient
These outcomes enabled more reliable reporting, faster turnaround times, and scalable reporting across multiple solar farms.
The Opportunity
Solar farms generate large volumes of operational data that scale with system size, # of components, and multiple levels (string, MPPT, inverter) and time intervals, but monthly reporting creating processes remain heavily manual and can become more complicated as the scale increases. Asset managers or engineers typically manually:
- Download irradiance, temperature, and inverter power data;
- Clean and filter the data;
- Perform KPI calculations such as PR (performance ratio), availability, etc, in spreadsheets;
- Prepare narrative reports for asset owners.
This workflow presents three key issues:
1. Accuracy and vulnerabilities
- Weather station and inverter anomalies distort PR;
- Human decisions on acceptable vs. unacceptable data can be subjective;
- Lack of automated checks increases the risk of incorrect reporting;
- Accuracy of the data assessment is critical. When underperformance is overlooked or detected late, there is a hidden revenue loss, which underutilises the asset. In contrast, if a false decision was made for maintenance based on overestimated performance losses, the cost can reduce the asset’s profit.
An accurate PR value is critical. When PR is underestimated, it can be interpreted as underperforming, leading to unnecessary inspection, over-servicing, cleaning, or maintenance downtime. Consequently, this will increase operational expenses (OpEx). On the other hand, when PR is overestimated, issues remain hidden, and revenue losses can persist longer until the problems are identified and addressed. A PR bias or error of even 1–2% can result in substantial misvaluation at large system scales, potentially amounting to many millions of dollars, particularly in refinancing contexts.
Moreover, PV assets often have PR guarantees, minimum performance thresholds, or covenants tied to debt service coverage ratios (DSCR), availability guarantees, and EPC warranty claims.
2. High time burden
Typically, engineers or data analysts spend 10–20 hours per site per month preparing reports, especially when datasets include missing or inconsistent values. Moreover, it can be more complicated when there are curtailments or maintenance downtime.
3. Frequent human errors and a scalable problem
Manual processes are vulnerable to:
- Spreadsheet formula mistakes or copy and paste errors;
- Wrong unit conversions;
- Manual misalignment of timestamps;
- Subjective judgment differences between engineers;
- Incorrect formula ranges;
- Double-counting or missing intervals;
- Failing to detect sensor drift;
- Misinterpreting noisy irradiance data.
As solar portfolios expand, the risk of human error could increase. A single utility-scale solar farm of around 500 MW can generate on the order of gigabytes of operational data every second [1], overwhelming manual analysis workflows and traditional spreadsheet-based practices. In many rapidly growing solar markets, particularly in developing countries, this technical complexity is compounded by a shortage of trained engineers and analysts.
In recent years, the solar industry has grown exponentially, requiring more skilled workers to maintain the solar farms. However, small-scale solar farms cannot retain their employees, as some highly skilled personnel may be offered better opportunities in larger projects. Moreover, as new staff are onboarded into increasingly complex systems, handover processes become longer and more fragile, while subjective judgment substitutes for standardised quality control. The challenge is amplified by the sensitivity of PV performance analysis to abnormal data: missing intervals, outliers, undetected sensor drift, or misinterpreted noisy irradiance signals can introduce systematic bias if not handled rigorously. As PV plant capacity scales and monitoring intervals become finer, robust data-quality routines are no longer optional; without them, the risk is not just isolated mistakes, but the erosion of confidence in performance assessments across entire solar portfolios.
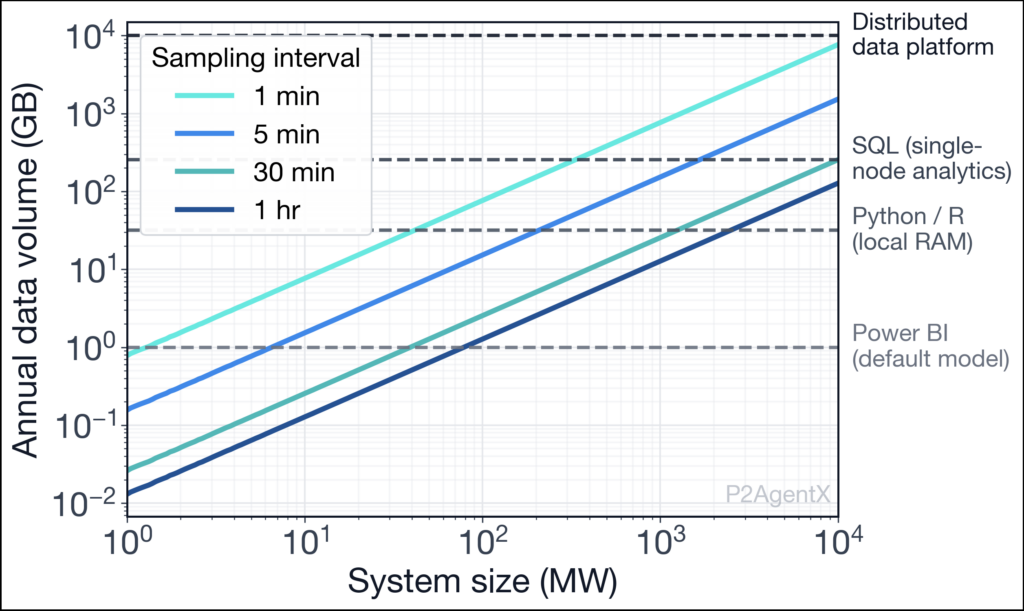
Figure 1. Example of # of annual data volumes in gigabytes (GB) for different system sizes and sampling intervals. Dashed horizontal lines indicate Typical computing and analytics tools (practical limits).
One of our clients with over 750 MW of solar farms in their portfolio has stated this.
“I believe we need to do a re-run validation on all our reports’ data for the last couple of months and verify these numbers. I have a feeling we have a huge potential for human error in our case!” – CEO of Utility-scale operator
The organisation needed a consistent, automated, and audit-ready reporting system that improves accuracy, saves time, and reduces human error.
The Solution
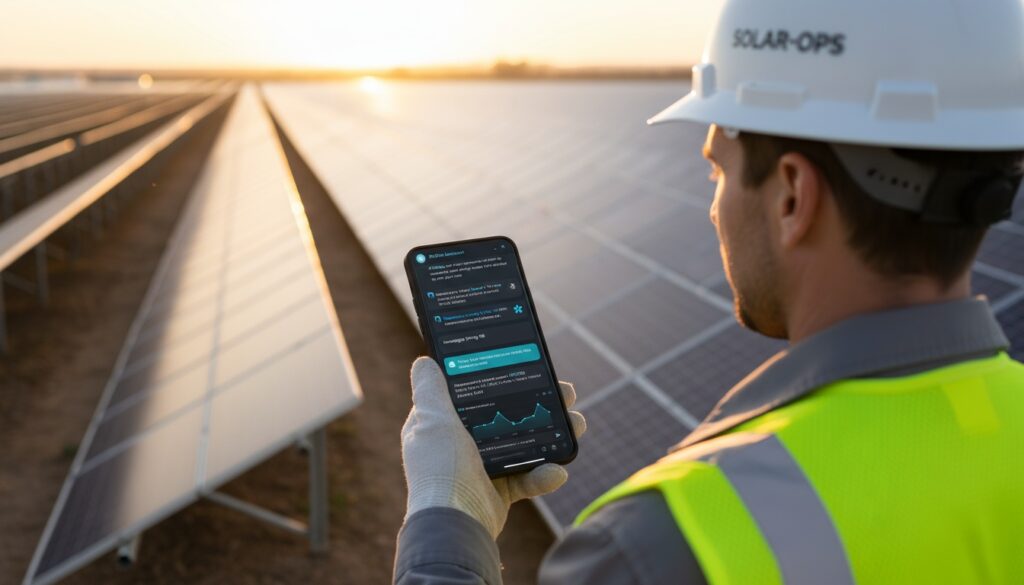
To address these challenges, the P2Chat was introduced to our customers as a conversational AI-agentic solution with a digital reporting feature explicitly designed for solar-farm KPI analysis.
P2Chat, which we developed, is a platform that runs 1) automatic data quality checks, 2) KPI analytics and 3) monthly report generation, which provides a scalable solution.
Key capabilities implemented
1. Automated data validation for improved accuracy
P2chat automatically checks each dataset against engineering rules such as:
- Zero-value detection;
- Missing timestamps;
- Irradiance and temperature operational ranges;
- Inverter energy consistency rules;
- Sudden jumps or drops in sensor readings.
This ensures AI agents work only with clean, validated data before PR calculations are performed.
The primary key KPI for asset management are: AC output (EAC), PR, plant availability (PA), and period performance (PP)[2].
2. A streamlined, automated reporting workflow
The P2Chat replaced slow, manual steps with a structured workflow:
- Simple prompting to analyse and calculate a wide range of KPIs;
- Automated data quality check, cleaning;
- Instant report generation (PDF or web-based, with interactive features).
3. Reduction in human error through controlled logic and transparent checks
Instead of subjective spreadsheet logic, P2Chat applies standardised formulas and verified engineering rules, thereby eliminating the listed human errors that, if misinterpreted, can lead to serious consequences, particularly for large-scale solar farms.
The Impact
The transformation delivered clear improvements across all three focus areas.
1. Accuracy Improvement
Before
Accuracy was heavily dependent on:
- Engineer judgment;
- Quality of the weather station;
- Consistency of manual cleaning.
Measurement issues often went unnoticed, leading to “false high” or “false low” PR values.
Before those KPIs are calculated, a data quality check is essential to ensure accurate performance measurement. An example of the data quality is shown in the table below.
| Components | Missing Data | Stale Data | Negative Values | Erroneous Data | Outliers | Data Completeness | Capacity Checks |
| Overall Power | 0.1% | 0.0% | 0.0% | 5.9% | 0.0% | 0.0% | 0.0% |
| Inverter 1 | 0.1% | 0.0% | 0.0% | 5.8% | 0.0% | 0.0% | 0.0% |
| Inverter 2 | 0.1% | 0.0% | 0.0% | 5.8% | 0.0% | 0.0% | 0.0% |
| Inverter 3 | 0.1% | 0.0% | 0.0% | 6.0% | 0.0% | 0.0% | 0.0% |
| Inverter 4 | 0.1% | 0.0% | 0.0% | 6.4% | 0.0% | 0.0% | 0.0% |
| Inverter 5 | 0.1% | 0.0% | 0.0% | 5.2% | 0.0% | 0.0% | 0.0% |
The manually calculated KPIs of the 3 months’ (July to Sep) solar farm data were compared to P2Chat’s output using the historical measurements during these periods. The EAC difference ranged from 0.1 to 3.6%, with some data initially excluded as erroneous by the data filtering.
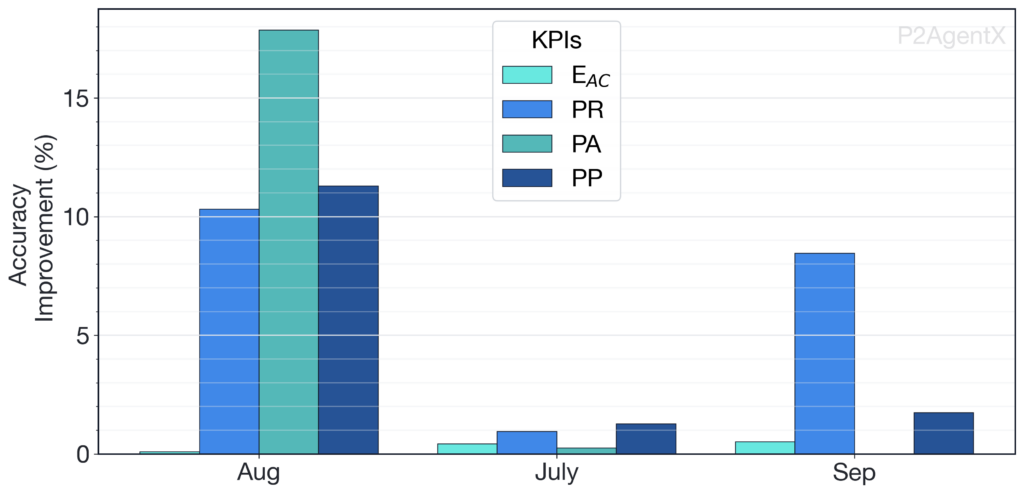
Figure 2. Accuracy improvement using P2Chat compared to the client’s conventional manual methods. Note: AC output (EAC), performance ratio (PR), plant availability (PA), and period performance (PP).
This improved the trustworthiness of monthly reports and reduced the risk of reporting incorrect performance to asset owners, thereby avoiding unnecessary OpEx or misestimating the system’s performance.
2. Time Saved Using P2Chat
Typical monthly processing time is 10-20 hours, including data downloading, manual cleaning, PR calculation, report creation and validation with 1 FTE (full-time equivalent) data analyst. Such processing time could also be substantially longer when solar farm scales are larger or when data is available at multiple levels, from strings to MPPTs and inverters.
Using P2Chat, the whole process typically takes less than 10 minutes, with most data ingestion, quality checks, and computation completed within a minute. The solution is also scalable and compatible with any products through API access. Engineer review is the primary factor in ensuring the report meets the requirements.
Net time savings: 90–95% reduction
This changed monthly PR reporting from a laborious task into a fast, repeatable process, and scaling effortlessly across larger portfolios. Our client has stated
“Since implementing P2Chat, our solar reporting workflow has been transformed. What previously took our team 40+ hours per month—cross-referencing SCADA logs, weather data, and inverter performance—now generates executive-ready reports in under 5 minutes. The automation not only accelerated turnaround but helped us detect critical faults early, cutting response times dramatically.” – CEO of Utility-scale operator
3. Human Error Identification & Reduction
Human error can lead to substantial consequences that may be difficult to determine, as it is often unclear whether the problem was caused by data handling. Using P2Chat with its standardised workflow and automated checks eliminates such human error, thereby improving consistency in data collection and interpretation, including data quality checks. Furthermore, any computational process can be continually reviewed for consistency and compared with the conventional approach.
Conclusion
By implementing P2Chat, operators achieved substantial improvements in monthly KPI reporting:
- Higher accuracy through automated anomaly detection, including data quality checks;
- Massive time savings (down to <10 minutes per month);
- Significant reduction in human errors, enabling reliable, consistent results, and providing resilience to the company to maintain accuracy and capability, especially when there is an impact on team members.
The platform now sets a repeatable standard for solar-farm reporting, supporting scalability, auditability, and improved decision-making for asset owners and engineers.
Appendix: Data Quality Check Summary
Data quality checks applied by the P2chat include:
1. Weather Station Checks
- Zero irradiance values during daylight;
- Unrealistic jumps in GHI (global horizontal irradiance)/POA (plane of array);
- Missing timestamps;
- Temperature outside physical thresholds;
- Drift or stuck sensor values;
- Unusual morning/evening gradients.
2. Inverter Data Checks
- Zero production during expected operating hours;
- Sub-second spikes or drops;
- Missing intervals;
- Non-physical energy jumps;
- Negative energy readings;
- Inconsistent MPPT performance.
3. Timestamp and Format Checks
- Non-uniform intervals;
- Daylight savings inconsistencies;
- Misaligned datasets;
- Duplicate records;
- Out-of-order sequences.
These checks ensure the PR calculation uses a clean, validated dataset, even without trend-based reconstruction.